Distributed Tracing
Distributed tracing is a method to track the API requests that interact through distributed cloud environments using a unique transaction identifier. This identifier stays throughout the transaction journey and offers real-time visibility to user experience, from the top of the stack to the application layer and other infrastructure.
Distributed tracing method is supported only in Kubernetes and does the following:
- Find accurate points of failure and reasons for bad performance
- Provide breakdown of our operations to our database, APIs, or other microservices
The below illustration provides the high-level design of distributed tracing.
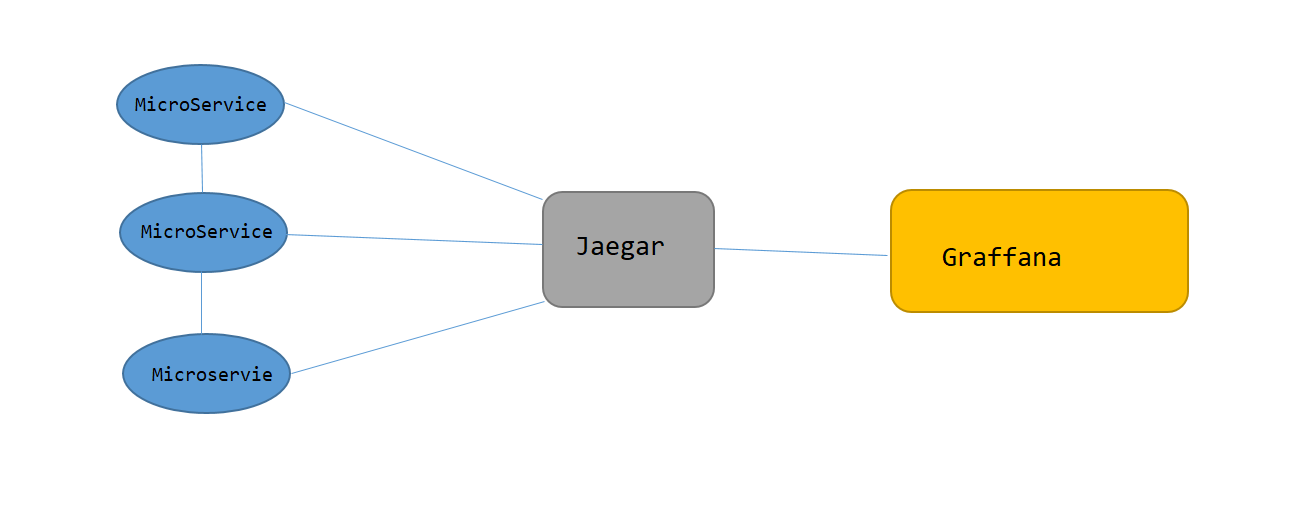
Temenos observability feature supports distributed API tracing or HTTP tracing.
API or HTTP Tracing
Distributed API Tracing is used to track a request as it traverses through many inter-dependent microservices. All systems that support distributed tracing use identifiers, that is, the trace context, that is passed along with the transaction. For HTTP, at least a trace ID is injected in the header of the outbound requests and the same is extracted from the header of the inbound requests.
Adding Dependencies
You must add the below dependencies in respective pom.xml
TemnMeter
<dependency>
  <groupId>com.temenos.technology</groupId>
  <artifactId>TemnTracer</artifactId>
<version>3.0.9</version>
</dependency>
TemnMonitorLib
<dependency>
  <groupId>com.temenos.technology</groupId>
<artifactId>TemnMonitorLib</artifactId>
<type>pom</type></dependency>
Configuring Tracer
You must add the below configuration in microservice YAML files to enable tracing in microservice.
|
Configuration |
Description |
|---|---|
|
temn.msf.tracer.enabled: boolean (true or false) |
Enables tracer functionality for a given service. |
|
Temn.tracer.host: hostname (Eg jaeger or “172.25.0.7”) |
Indicates the hostname or service name of any tracer backend service. Currently, Jaeger is used. |
| temn.tracer.port: 14268 | Indicates the port number of the tracer backend service. |
| temn.msf.service: Any string (Eg INGESTER) | Generates the name of the service when defined in Temn-Microservice. For example, TEMN-MICROSERVICE-{MSname}-{service.name}. |
Monitoring Package
Monitoring package is part of TemnMonitoring solution, which contains services to process, visualize and analyze tracing, logging and metrics data instrumented by each microservice.
To launch monitoring services,
- Checkout the TemnMonitor pack. For more information, see Launch Monitor.
- Go to ../temnmonitor/.. package, open command prompt, and run launch-monitoring up --build -d
Monitoring package is launched successfully.NOTE: You need to ensure the docker is up and running.
To stop Tracer in Temnmonitor, you must run launch-monitoring down in command prompt.
Visualization Guide
Visualization guide helps to view the distributed tracing in Jaeger UI.
Using the Visualization Guide, you can:
- Access Jaeger UI through the HTTP://{hostname}:16686/search endpoint.
- Use Service, Operation, and Tags in the left pane to filter traces created by different type of microservice, spans and their tags.
- Select a trace to visualize the span operation and tag information of that trace.
- Collect the JSON response of trace data through http://{hostname}:16686/api/traces?operation={spanName}&service={service name}.
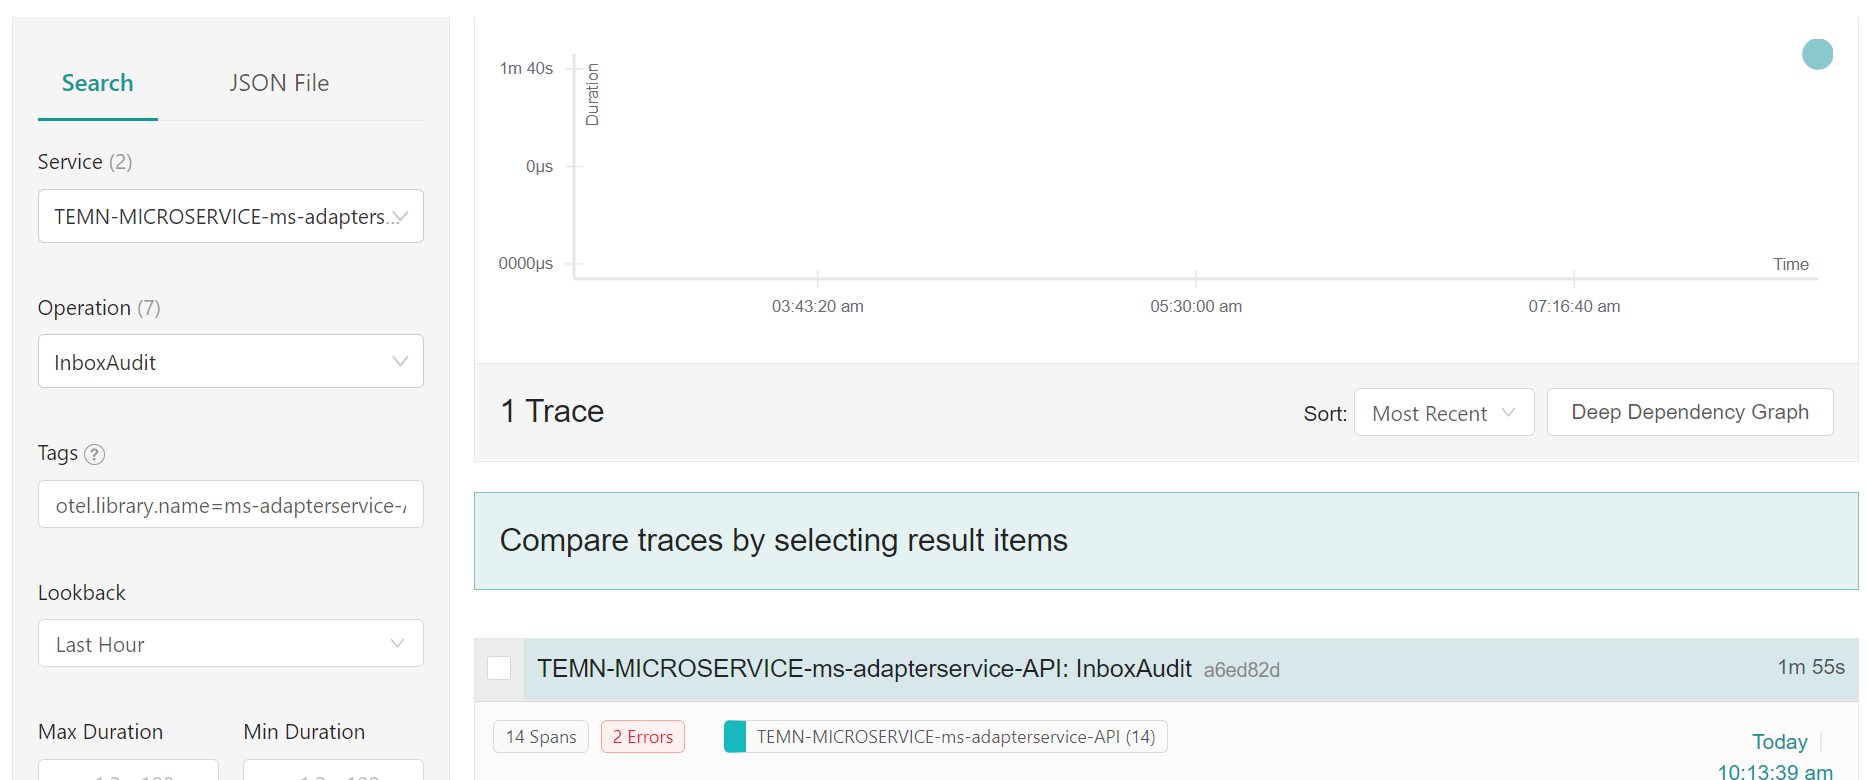
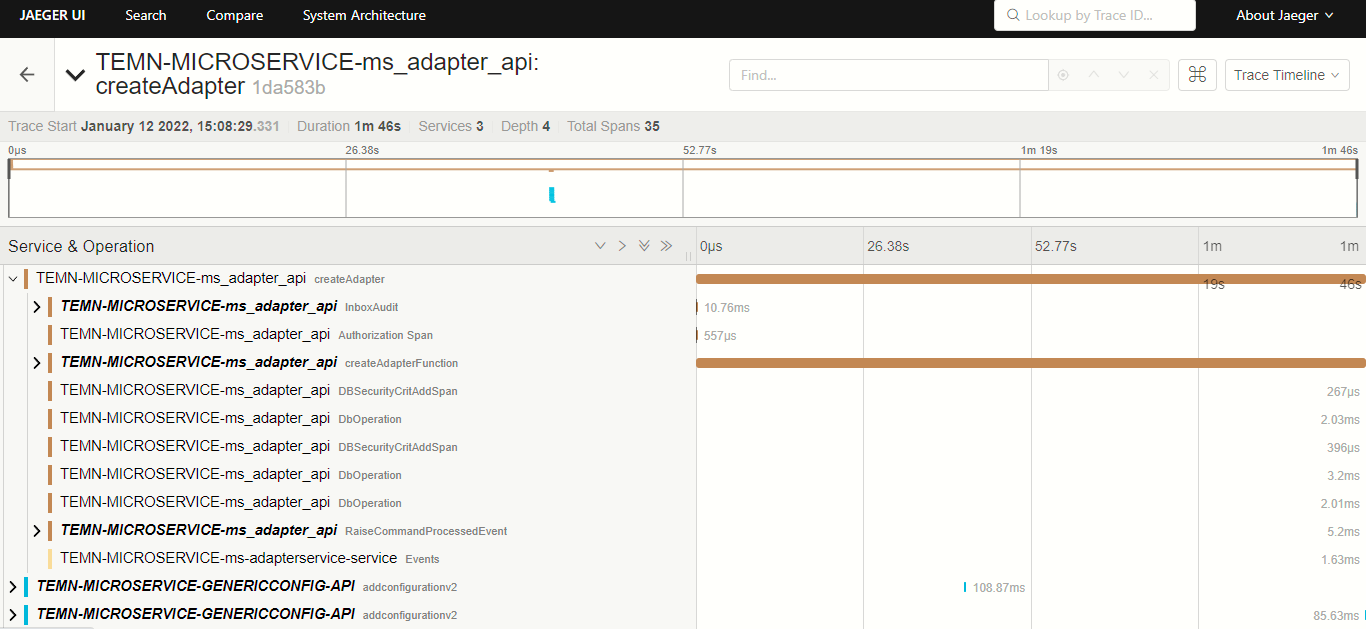
Distributed Tracing Sample Dashboard
The below screen captures show the sample dashboard of Jaeger UI, Tracer and Span.
Jaeger UI:
Tracer and Span:
In this topic
