Metrics
This section helps you to configure the metrics and monitoring package.
A central Meter library is used as a common metric framework across the products. Monitoring system collects and records data over time to expose high-level metrics, which are useful to determine the overall health of a distributed system.
You can monitor key application performance metrics using the Open telemetry data in the industry-standard dashboard by enabling the framework to provide support for the metrics. These metrics are enabled in eight infra microservices to verify the application in UI.
All kinds of Microservices consist of API, INGESTER, Scheduler and DB services. Separate metrics are added to each service.
API metrics enables you to monitor API usage, which gives you an insight into how your APIs are used and performed. They provide detailed information about the APIs, and you can sort the data using the available filters.
- API Timer - Temn_Msf_Api_Timer
Available filters - service, http_operation, http_method, Time
- API Active Guage - Temn_Msf_Api_Active_Gauge
Available filters - service, http_operation, http_method
- API Deactive Guage - Temn_Msf_Api_Deactive_Gauge
Available filters - service, http_operation, http_method
- API Counter - Temn_Msf_Api_Counter_total
Available filters - service, http_operation, http_method, status
Database metrics helps you to understand and analyse the performance, quality assurance, and crisis for a single or multiple department.
- DB Timer - Temn_Msf_Database_Timer , Available filters - service, entity, statement_type, Time
- DB Active Guage - Temn_Msf_Db_Active_Gauge , Available filters - service, product, status
- DB Deactive Guage - Temn_Msf_Db_Deactive_Gauge , Available filters - service, product, status
- DB Counter - Temn_Msf_Db_Counter_total , Available filters - service, entity, statement_type
- Ing Timer - Temn_Msf_Ing_Timer , Available filters - service,Time
- Ing Active Guage - Temn_Msf_Ing_Active_Gauge, Available filters - service, product, status
- Ing Deactive Guage - Temn_Msf_Ing_Deactive_Gauge , Available filters - service, product, status
- Ing Counter - Temn_Msf_Ing_Counter_total, Available filters - service, status
- Event Source Counter - Temn_Msf_Event_Source_Counter_total, Available filters - service, topic
- Event Sink counter - Temn_Msf_Event_Sink_Counter_total, Available filters - service, topic
- Scheduler Timer - Temn_Msf_Scheduler_Timer , Available filters - service, Time, OperationId
- Scheduler Active Guage - Temn_Msf_Scheduler_Active_Gauge, Available filters - service, product, status
- Scheduler Deactive Guage - Temn_Msf_Scheduler_Deactive_Gauge, Available filters - service, product, status
- Scheduler Counter - Temn_Msf_Scheduler_Counter_total , Available filters - service, OperationId
It calculates the time difference between the start the end of process.
- Temn_Msf_Api_Timer{} - is used to see all API Timer Metrics
- Temn_Msf_Api_Timer{filterValue} - is used to see filter Metrics
- rate(Temn_Msf_Api_Timer{http_operation="GetPaymentOrder"}[$__interval])
- rate(Temn_Msf_Api_Timer{http_operation="GetPaymentOrder"}[5m]) - calculates the per-second average rate of increase of the time series in the range vector.
- avg(Temn_Msf_Api_Timer{}) - calculates average time value
Active Guage:
It counts the number of Active request - Temn_Msf_Api_Active_Gauge{}
Deactive Guage:
It counts the number of de-active Request - Temn_Msf_Api_Deactive_Gauge{}
SUM(Temn_Msf_Api_Active_Gauge{} - Temn_Msf_Api_Deactive_Gauge{}) - used to find the total number active request.
Counter:
It calculates the number of API count.
Temn_Msf_Api_Counter_total{} - used to see all API count
Temn_Msf_Api_Counter_total{filterValue} - is used to see filter Metrics
Dependency
Below dependencies are need to be added in respective pom.xml
TemnMeter dependency:
<dependency>
<groupId>com.temenos.technology</groupId>
 <artifactId>TemnMeter</artifactId>
 <version>4.0.3</version>
</dependency>
TemnMonitorLib Dependency:
<dependency>
<groupId>com.temenos.technology</groupId>
<artifactId>TemnMonitorLib</artifactId>
<type>pom</type>
</dependency>
Configuration
The below configuration should be added to enable the metrics in microservices
| Property Name | Sample Value |
|---|---|
| temn.meter.publisher.host | 127.0.01 (hostName) |
| temn.meter.publisher.port | 9091 (Port) |
| temn.meter.disabled | False |
Monitoring Package
Monitoring package is a part of TemnMonitoring solution, which contains services for processing, visualizing and analyzing, tracing, logging and metric (under observability of MS) data instrumented by each microservice.
Launching Monitoring Pack
To launch monitoring services :
- Checkout TemnMonitor pack from respective bitbucket link.
-
Go to ../temnmonitor/.. package.
NOTE:Ensure the docker is up and running.
-
Open command prompt and run launch-monitoring.bat up --build -d.
-
The monitoring pack has been launched successfully.
To stop the service, run the launch-monitoring down.
Visualization Guide
Visualization guide helps you to configure the monitoring package as shown below:
- Log into the grafana. http://localhost:3000/ using "admin" as the Username and Password.
- Once logged in data source for Grafana, configure the dashboard.
- Under configuration section, select data source > Prometheus.
- Go to dashboard section and select Microservices_Metrics dashboard.
Sample Dashboard
The sample dashboard consists of the Prometheus Data Source Configuration, Dashboard in Graffana, Sample Chart for Timer, Sample Counter Metrics and Sample Gauge Metrics.
| Sample Dashboard | Example |
|---|---|
| Prometheus Data Source Configuration | 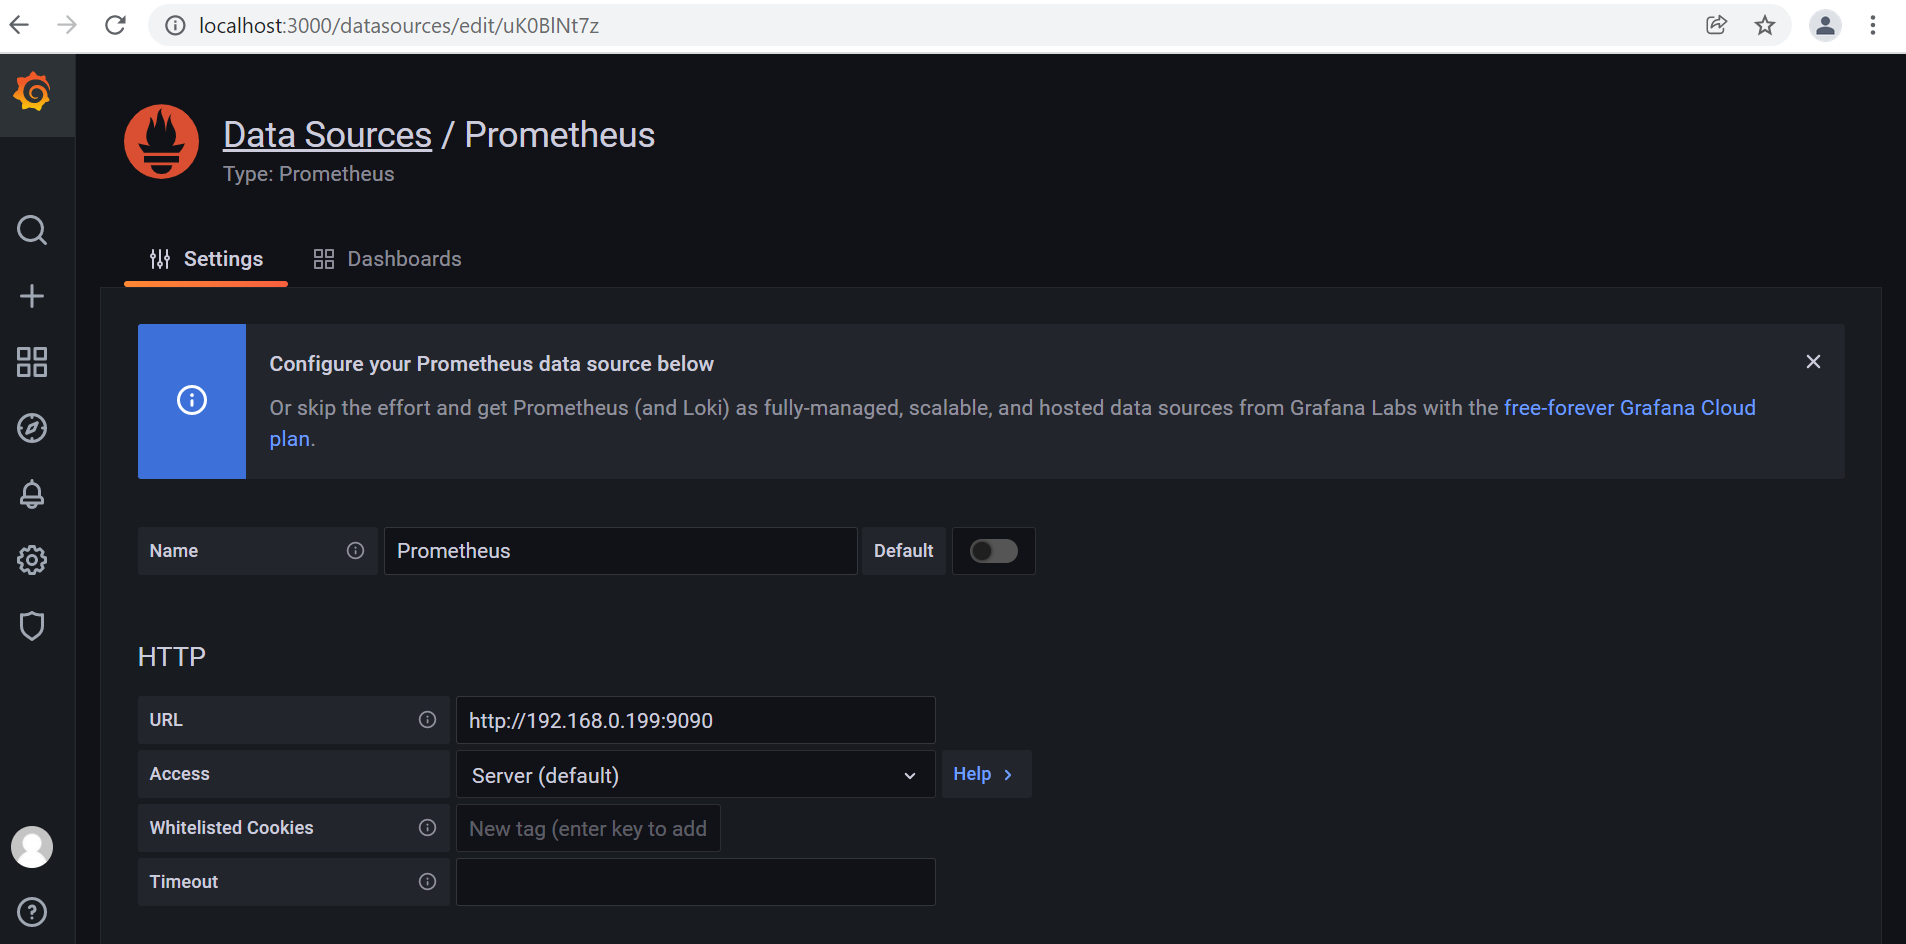
|
| Dashboard in Graffana | 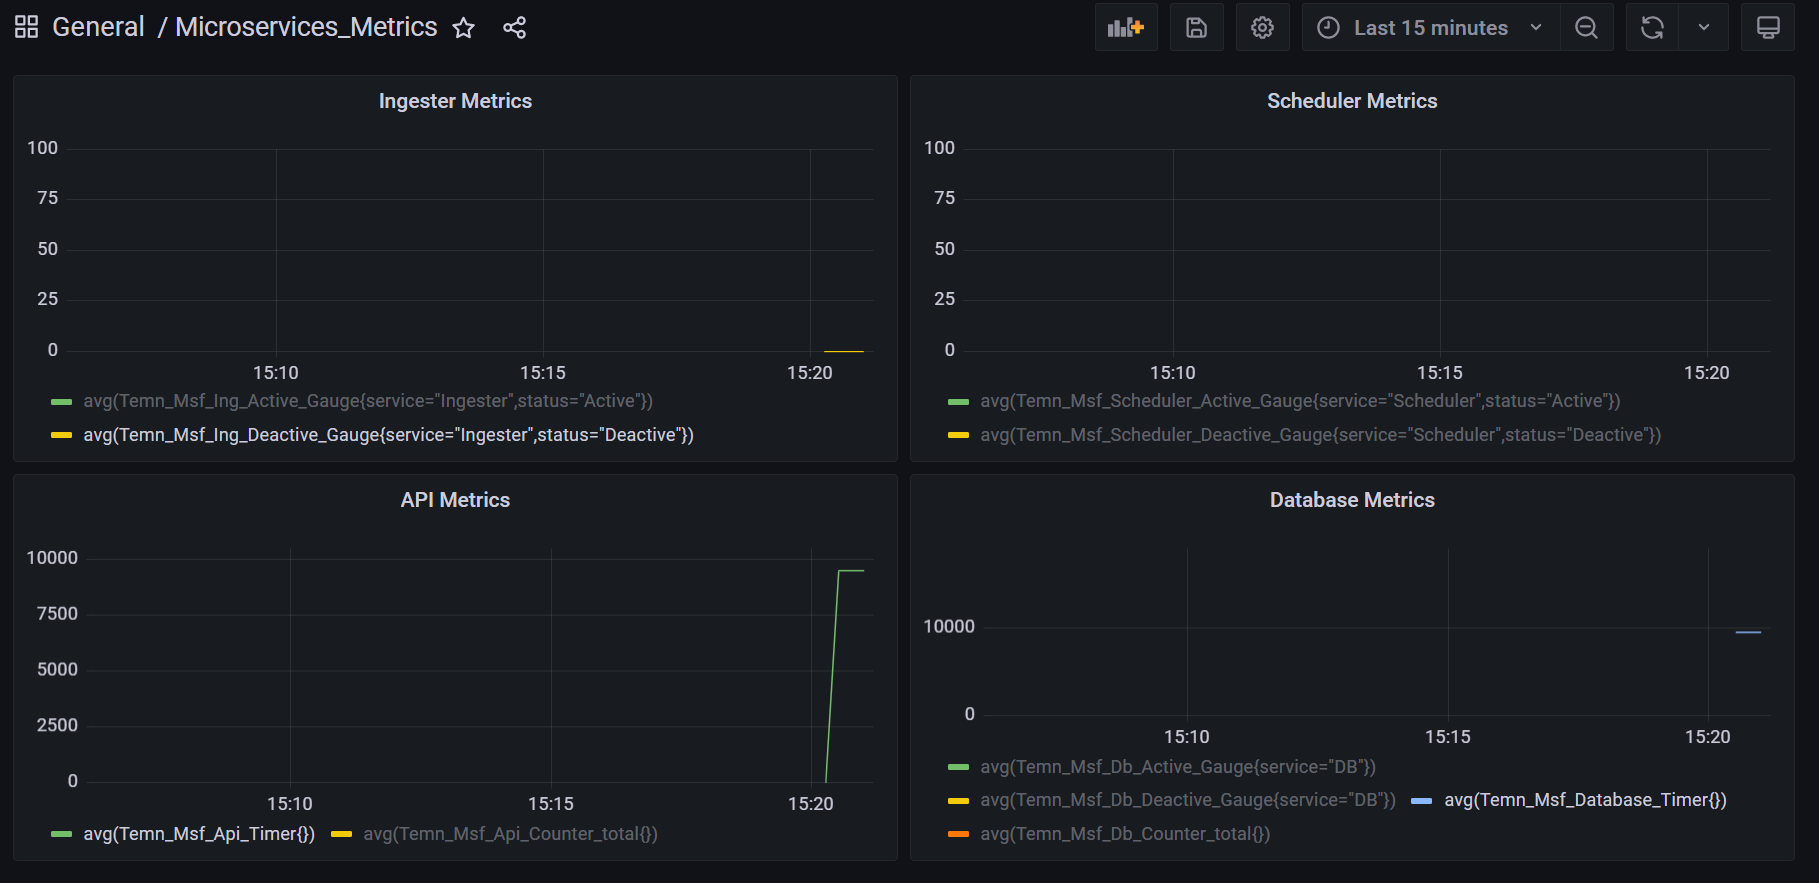
|
| Chart for Timer | 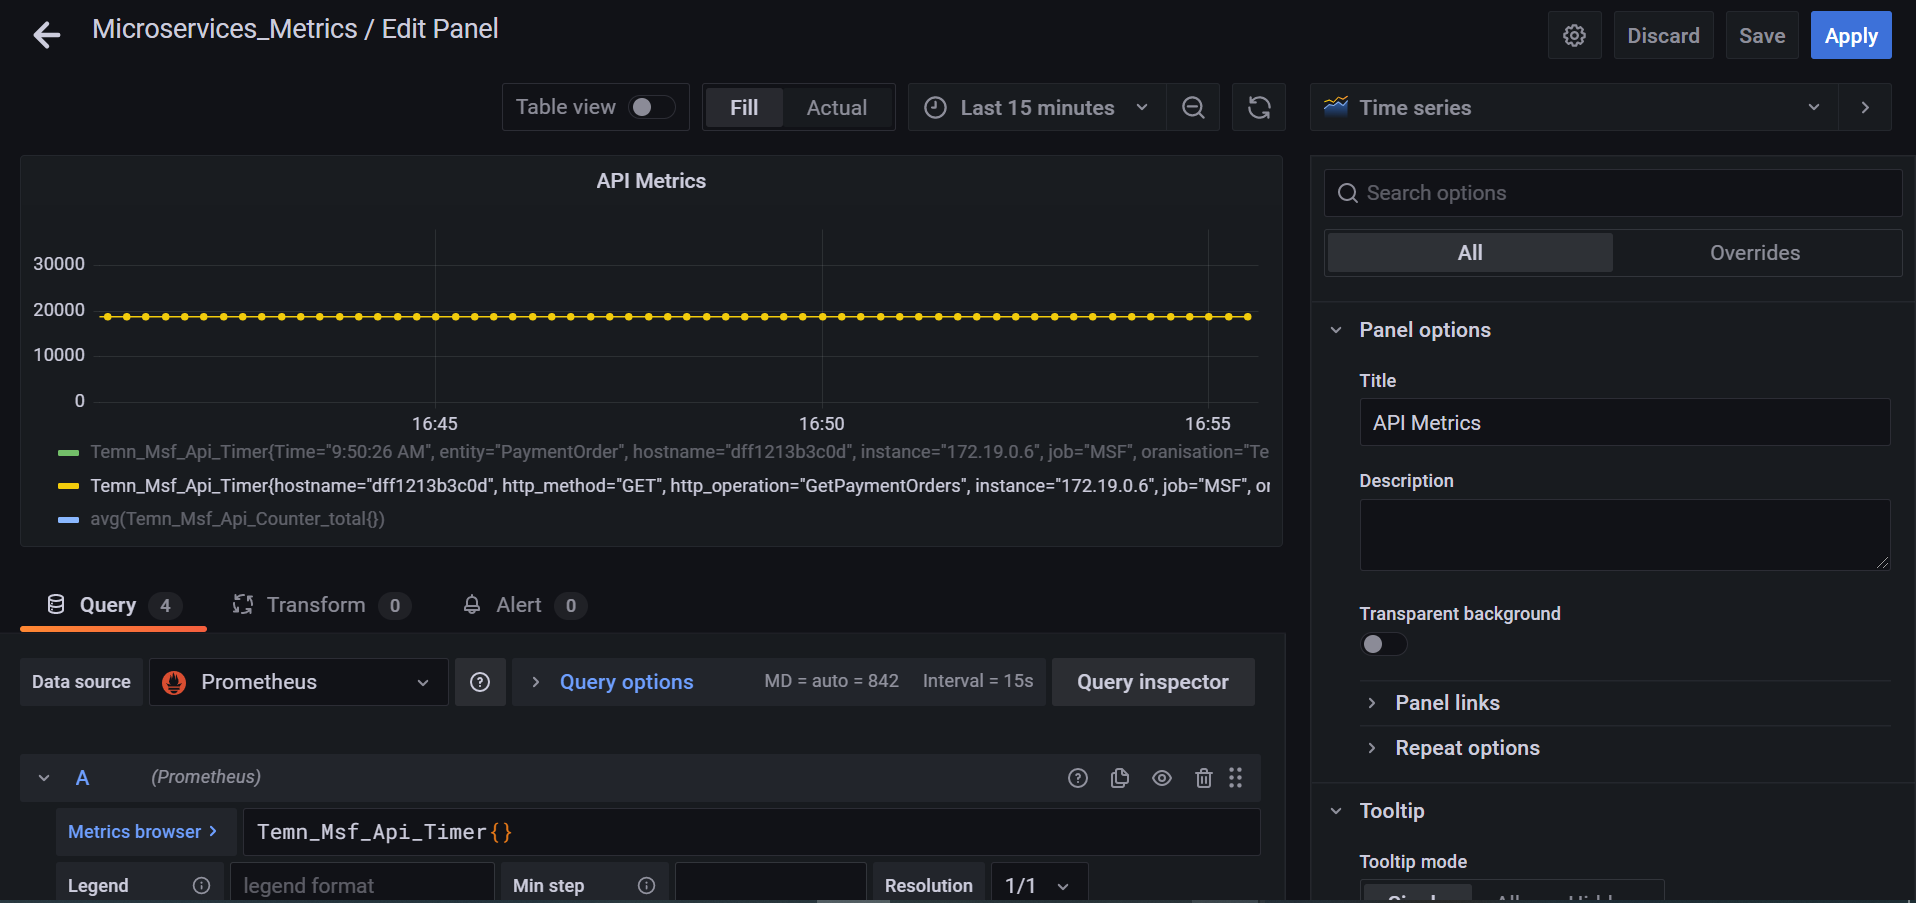
|
| Counter Metrics | 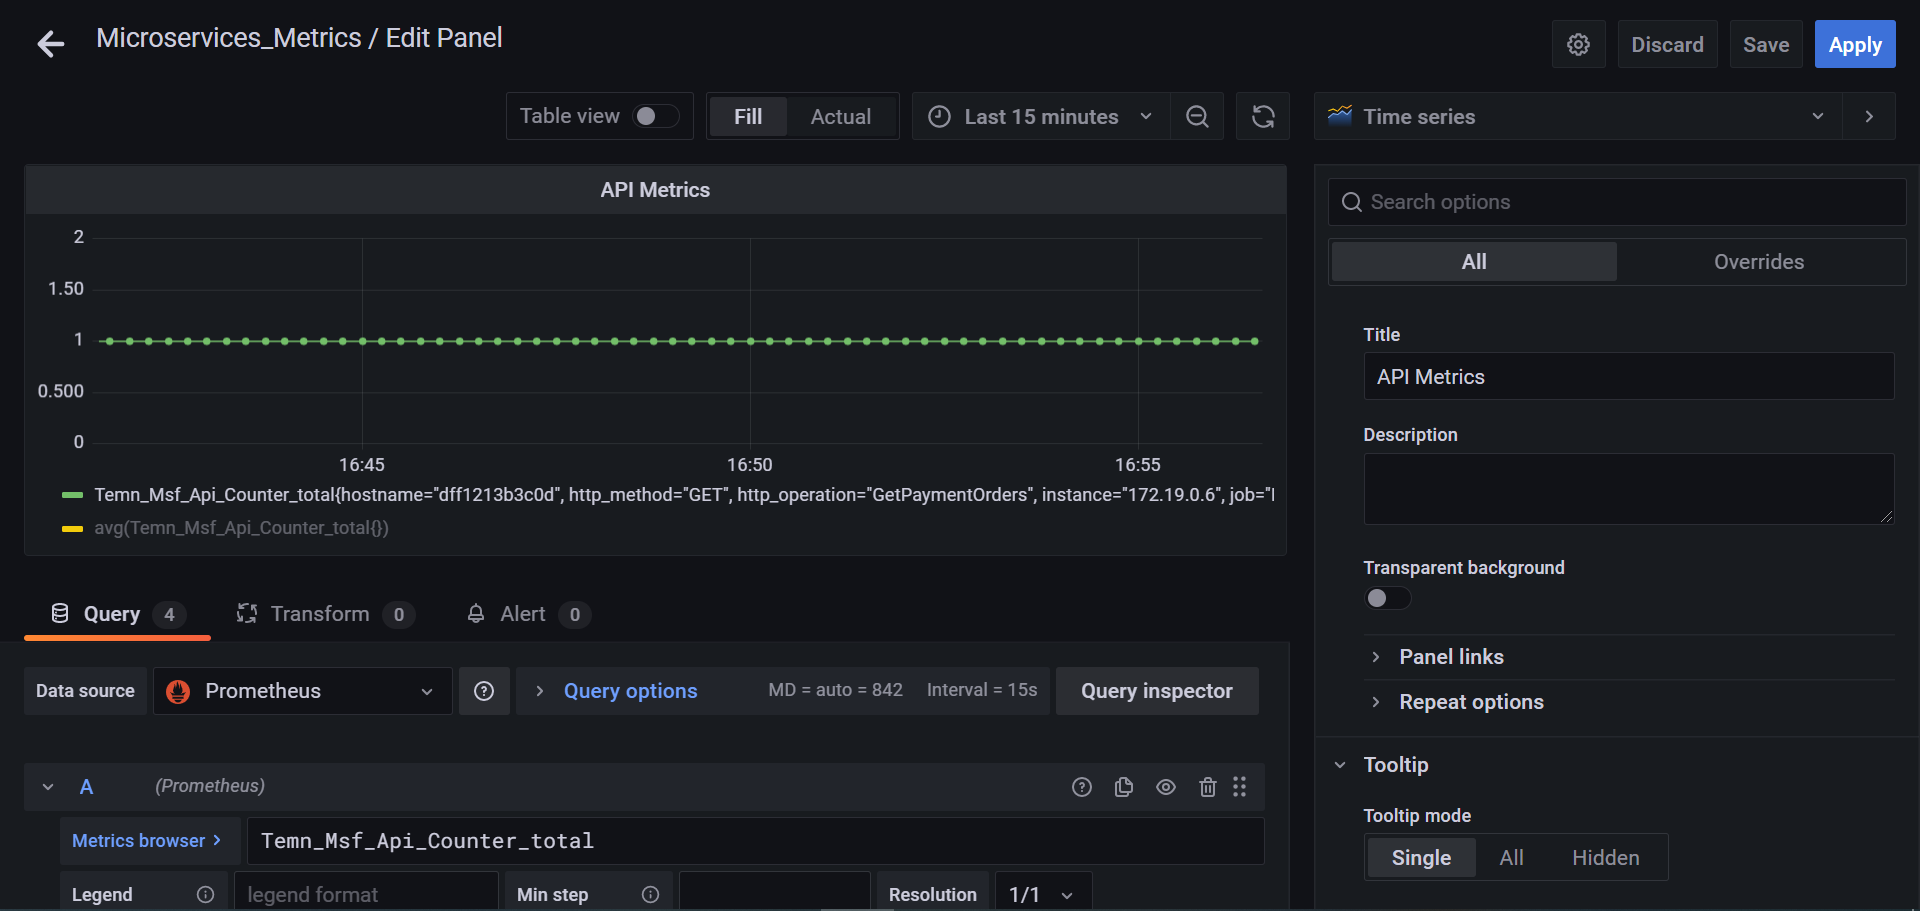
|
| Gauge Metrics | 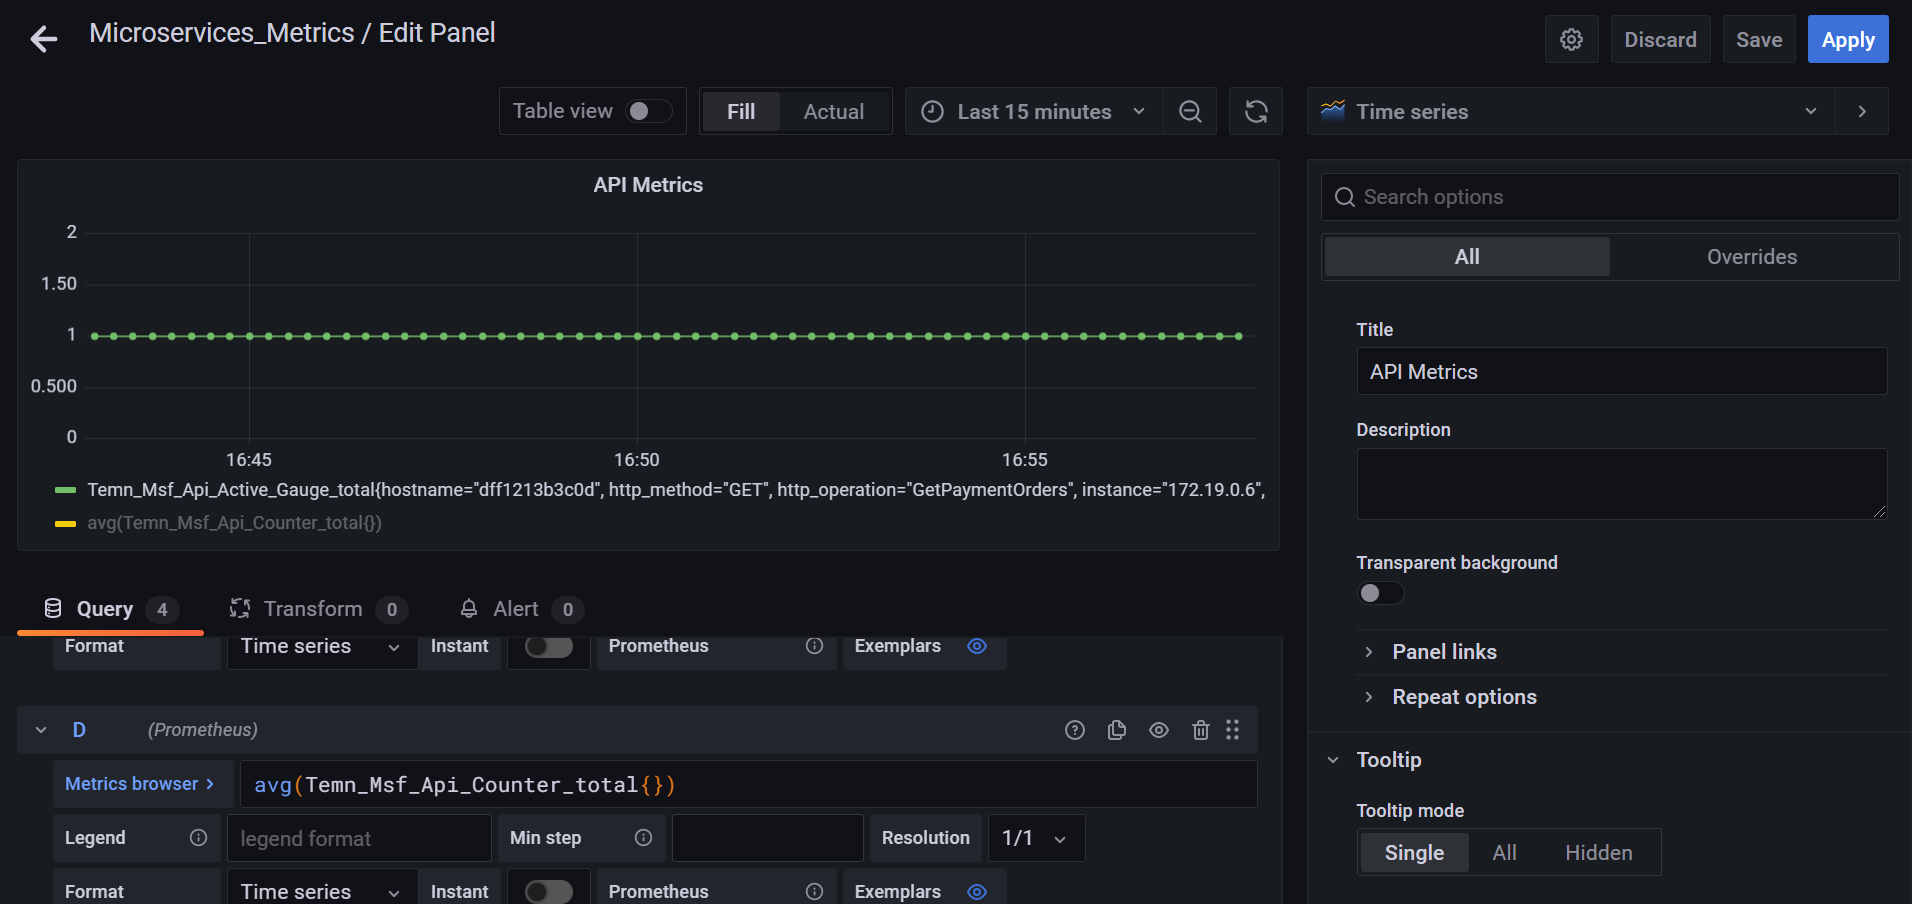
|
In this topic
