Distributed Logging
Microservice deployer prefers to view all MS logs in single use interface page. Distributed logging is the one that shows all logs in Grafana UI. Here, Logstash is used for creating ingestion pipeline for collecting logs from multiple devices and store in Elastic search storage for visualizing and analyzing through Grafana.
Adding Dependencies
You should add the following dependencies in the respective pom.xml.
-
TemnLogger dependency:
<dependency>
 <groupId>com.temenos.technology</groupId>
<artifactId>TemnLogger</artifactId>
<version>2.2.0</version>
</dependency>
-
TemnMonitorLib Dependency:
<dependency>
<groupId>com.temenos.technology</groupId>
<artifactId>TemnMonitorLib</artifactId>
<type>pom</type>
</dependency>
Log4j Configuration
You should perform the following configuration in the log4j property file to enable the distributed logging in microservices. The property file can be different in logging framework. As it is the default logging framework used in microservices, log4j is used.
| Change Description | Description |
|---|---|
| Initializing value from env configuration | property.rootLoggerLevel=${env:temn.msf.logger.root_level:-INFO}
property.logstashPort=${env:temn.msf.logger.socketPort:-4560}
property.logstashHost=${env:temn.msf.logger.socketHost:-logstash}
property.rootLoggerAppender=${env:temn.msf.logger.exportType:-console}
|
|
Socket based appender for sending log to log collector. Socket port and host are made configurable. |
appender.socket.type = Socket
appender.socket.name= socket
appender.socket.host = ${logstashHost}
appender.socket.port = ${logstashPort}
appender.socket.layout.type=PatternLayout
appender.socket.layout.pattern=%m%n
appender.socket.connectTimeoutMillis = 2000
appender.socket.reconnectionDelayMillis = 1000
appender.socket.protocol = TCP
|
| Route configuration to dynamically select appender based on env configuration | appender.routing.type = Routing
appender.routing.name = routing
appender.routing.routes.type = Routes
appender.routing.routes.pattern = ${rootLoggerAppender}
appender.routing.routes.console.type = Route
appender.routing.routes.console.ref = console
appender.routing.routes.console.key = console
appender.routing.routes.socket.type = Route
appender.routing.routes.socket.ref = socket
appender.routing.routes.socket.key = socket
|
| Updating newly created appender and router to the original appender list. | appenders=..., socket,console,routing |
| Update routing ref to root logger. | rootLogger.appenderRef.routing.ref = routing |
Service Configuration
You should configure the below mentioned environment properties in all services like API, Ingester & Scheduler to connect to Logstash and MS logs are pushed.
| Stack | Change Description | Change |
|---|---|---|
| Docker | Logstash port and host name under env section of each service | temn.msf.logger.socketHost: (ipaddress) - Logstash exposed host name temn.msf.logger.socketPort: (port) - Logstash exposed port name temn.msf.logger.exportType: (console,socket) - Log appender type. temn.msf.service: API – give service name (Ingester/Scheduler) |
| Kubernetes |
1. Configmap
2. Helm values configuration in values.yaml file |
{{- if .Values.logging.exportType }} temn.msf.logger.exportType: {{ .Values.logging.exportType }} {{- if eq .Values.logging.exportType "socket" }} temn.msf.logger.socketHost: {{ .Values.logging.socketHost | quote }} temn.msf.logger.socketPort: {{ .Values.logging.socketPort | quote}} {{- end }} {{- end }} temn.msf.service: API – give service name (Ingester/Scheduler)
logging: socketHost:(ipaddress) // Logstash exposed host name socketPort: (port) // Logstash exposed port name exportType: (console,socket) // Log appender type. |
Monitoring Package
Monitoring package is a part of TemnMonitoring solution, which contains services for processing, visualizing and analyzing, tracing, logging and metric (under observability of MS) data instrumented by each microservice.
Launching Monitoring Pack
To launch monitoring services :
- Checkout TemnMonitor pack from respective bitbucket link.
-
Go to ../temnmonitor/.. package.
NOTE:Ensure the docker is up and running.
-
Open command prompt and run launch-monitoring.bat up --build -d.
-
The monitoring pack has been launched successfully.
To stop the service, run the launch-monitoring down.
Visualization Guide
Visualization guide helps you to configure the monitoring package as shown below:
- Log into grafana (http://localhost:3000/) using "admin" as the Username and Password.
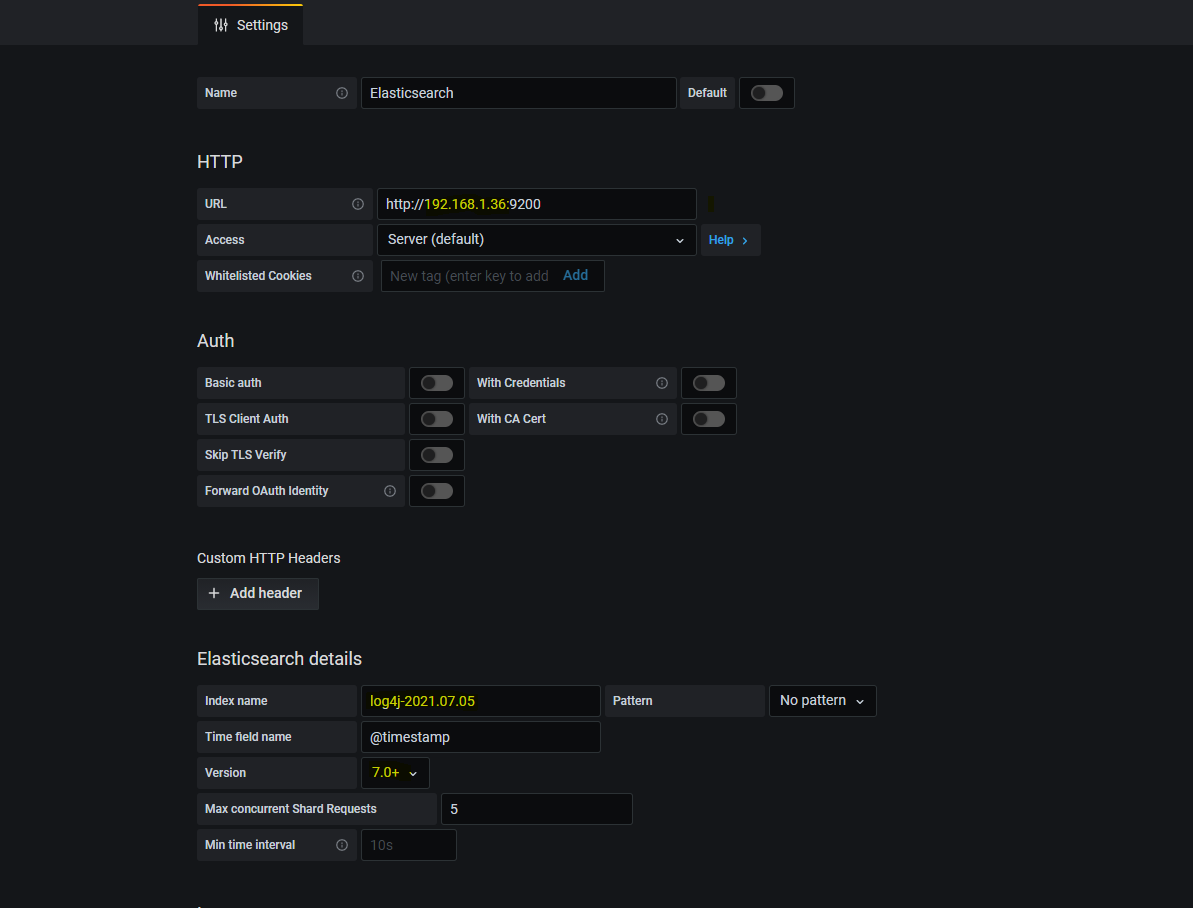
- Once logged into data source for grafana dashboard, configure the data source with an IP address.
- Under configuration section, go to data source > elastic search.
- Replace the host name in elastic search URI with host IP address.
- Under elastic search details, update index name with value of format log4j-%{+YYYY.MM.dd}. Sample value - log4j-2021.06.30.
- Increase version to 7.0+.
- Click Save & Test to confirm the changes.
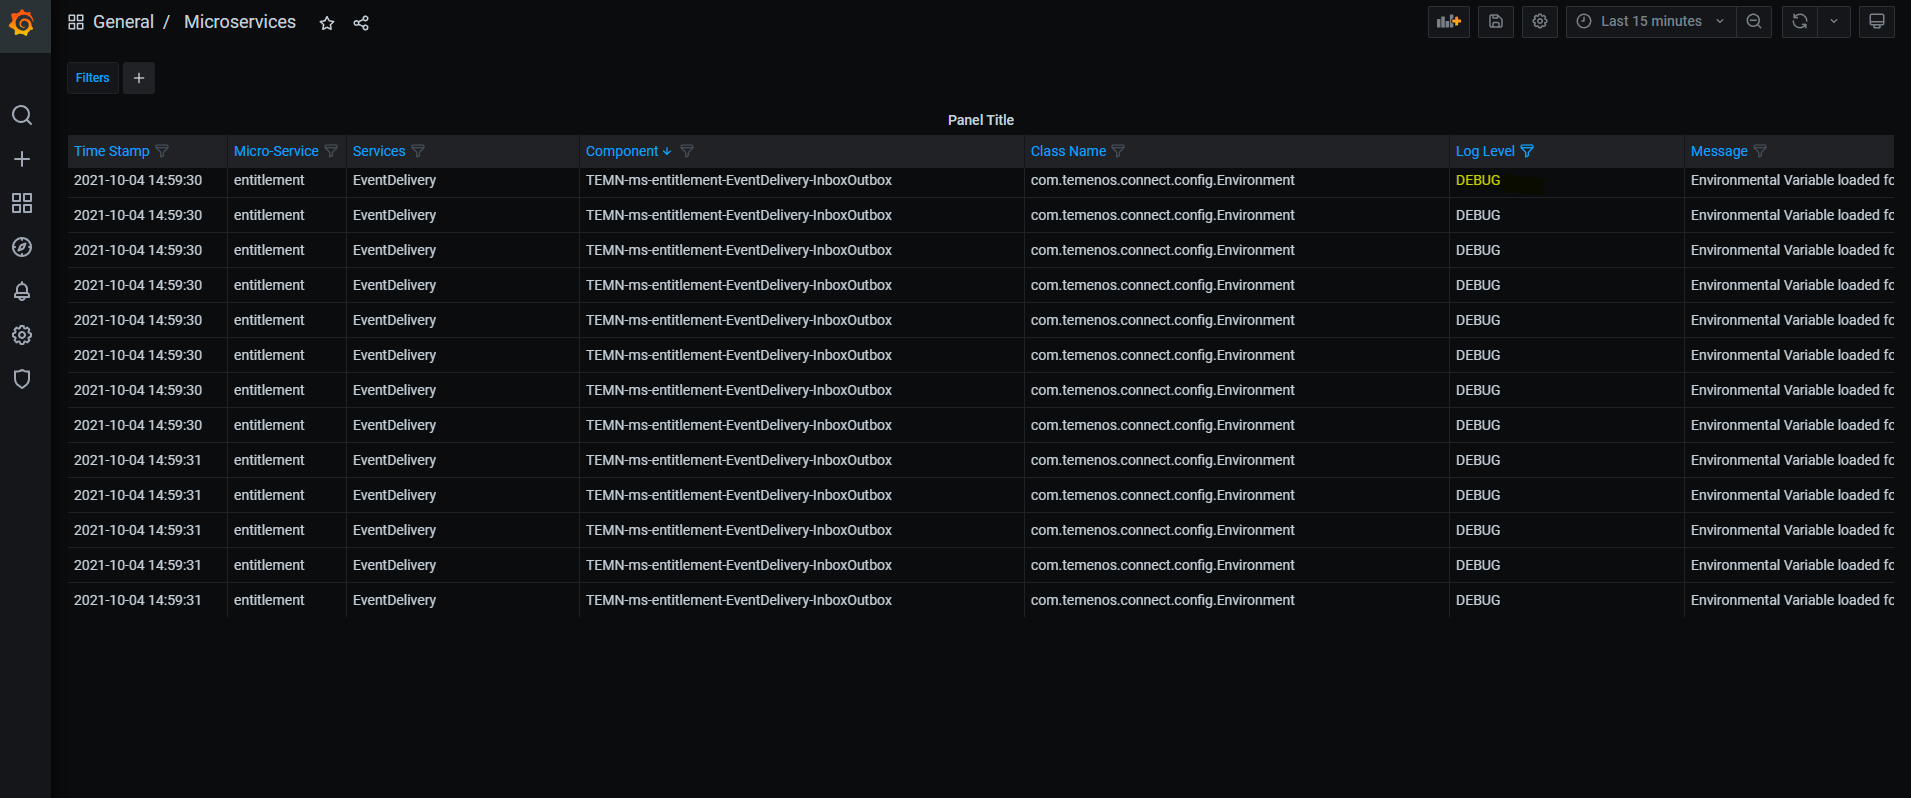
- Go to dashboard section and select Microservices
Sample Dashboard
The sample dashboard consists of the Elastic Search Data Source Configuration and Dashboard in Grafana.
- Elastic Search Data Source Configuration:
- Dashboard in Grafana:
In this topic
