Observability
This section explains the observability of distributed logging and tracing services using Metrics in Microservices.
Temenos supports observability mechanism to trace, measure and log information thus eliminating the time spent on diagnosing issues and providing out of the box health metrics. This section provides details about metrics, distributed logging and tracing.
Temenos recommends the below stack to enable observability across microservices.
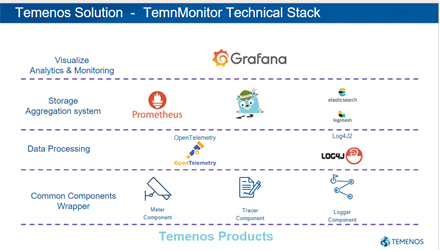
From the microservice layer, the system invokes the common libraries to support observability in microservices as shown in the below illustration.
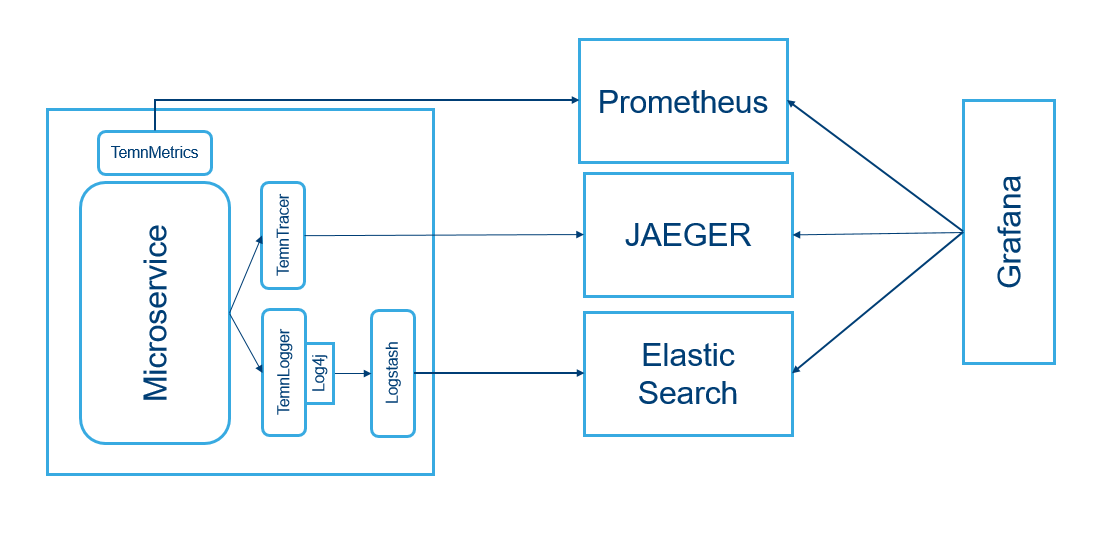
TemnMonitor library is a common infrastructural library that abstracts the implementation required to achieve observability and guides Temenos products to use published interfaces to log, trace and metrics data shared with relevant services.
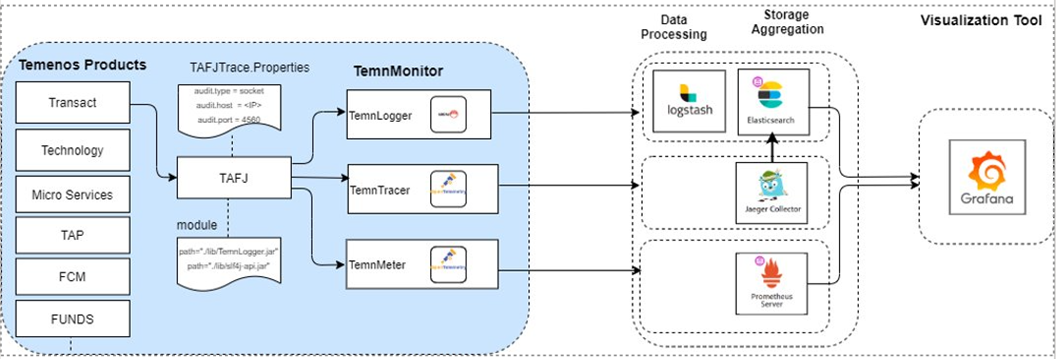
As a prerequisite, you must have a TemnMonitorLib artefact to deploy TemnTracer in your product.
-
Trace
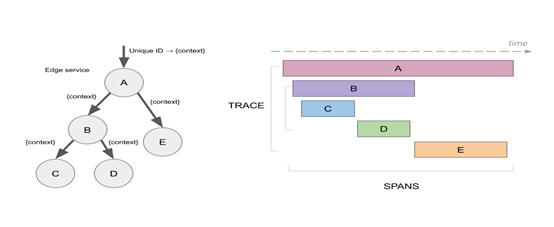
A trace is a series of events with causal ordering to understand the request lifetime through a distributed system. This trace helps you to,
-
Understand the chronological sequence of events and build the complete story of a transaction
-
Identify the amount of work done at each layer and shows information as a layer, which is easy to understand rather than checking log files.
-
-
Span
A span is a single operation within a trace. Each span has a name that represents the operation captured by the span and a service name that represents where the operation has taken place.
This section helps you to configure the distributed logging and monitoring package in microservices.
This section helps you to configure the metrics and monitoring package.
This section helps you to configure the distributed tracer and monitoring package in microservices.
In this topic
